2025 Colorado Aviation Economic Impact Study Summary
The 2025 Colorado Economic Impact Study (CEIS) quantifies the on-airport and visitor spending economic impacts at airports throughout Colorado. Economic impacts will be estimated for each individual airport included in the study, updating the prior impacts published in 2020. The CEIS is a tool to communicate the benefits of airports, both quantitative and qualitative, and helps justify the continued public investment in Colorado’s airport system. The 2025 CEIS will also include a detailed analysis of the role of airports in supporting air cargo and economic development, the contribution of airports to Colorado’s agriculture industry, tax impacts from aviation activity, and the vast economic impact of the Denver International Airport.
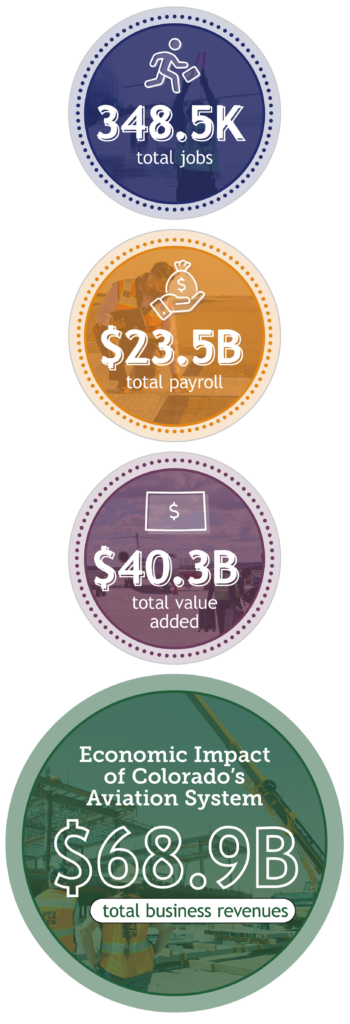
2025 Colorado Aviation Economic Impact Study Results
The 2025 CEIS explored the economic activity generated by the State’s 66 public use airports which serve tourism, business, air cargo, and military activities. Each airport plays a unique and important role in the state system and the community it serves, providing gateways for more than 13 million combined visitors per year and supporting businesses on and off the airport. When considering activities from airport administration, business tenants, construction, air cargo, and out-of-state visitor spending, Colorado’s aviation system supports more than 348,000 jobs and $23.5 billion in payroll. This activity generates $68.9 billion in business revenue and contributes $40.3 billion in added value to the state’s economy. For more information about the results of the 2025 CEIS, access the executive summary, technical report, and other deliverables here.

Comparison with the 2020 CEIS and Impact of Inflation
Colorado’s aviation industry has experienced substantial growth in the past five years, leading to a significant increase in statewide total economic impacts. However, when comparing the results of the 2025 CEIS (2023 data year) and the previous 2020 CEIS (2018 data year), it is important to consider larger economic trends that have affected the economic impacts calculated in each study. Most notably, record inflation has led to a 21 percent escalation of monetary impacts (payroll, value added, and business revenues) for a given number of associated jobs. The below table illustrates the impacts of inflation by comparing results of the 2025 CEIS with both the original results of the 2020 CEIS (2018 dollars) and the results adjusted for inflation (2023 dollars) to further demonstrate both the impacts of inflation and the true growth of the state aviation industry.
Statewide Impacts | Jobs | Payroll | Value Added | Business Revenues |
|---|---|---|---|---|
| 2025 CEIS Statewide Results (2023 Dollars) | 348,466 | $23,485,321,000 | $40,330,918,000 | $68,850,938,000 |
| 2020 CEIS Statewide Results (2018 Dollars) | 345,661 | $16,173,035,000 | $27,025,194,000 | $48,613,199,000 |
| 2020 CEIS to 2025 CEIS Percent Change | 1% | 45% | 49% | 41% |
| 2020 CEIS Adjusted Statewide Results – 2023 Dollars (Accounting for 21% inflation) | 345,661 | $19,618,387,000 | $32,782,388,400 | $58,969,300,000 |
| 2020 CEIS Adjusted to 2025 CEIS Percent Change (Accounting for 21% inflation) | 1% | 20% | 23% | 17% |